Oct 5, 2026
Hypersonic Propulsion Systems: Thermal-Protection Design Challenges at Mach 5+, and How Modeling Cuts Down on Physical Testing
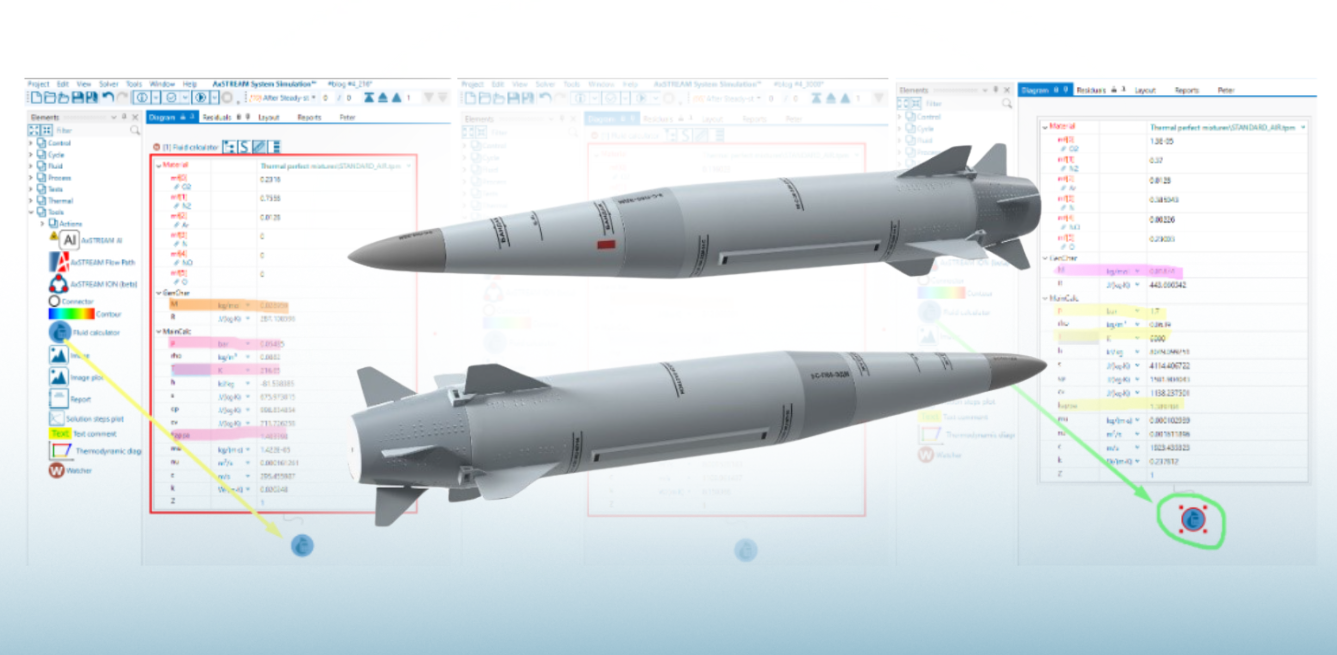
The breakdown of hypersonic propulsion systems and their thermal-protection design challenges.
Fly fast enough, and the air stops being just something you move through — it starts pushing back, both mechanically and thermally. Hypersonic flight simply isn’t possible without effective thermal protection. At Mach 16, at an altitude of 20 km, the stagnation temperature exceeds that of the Sun’s surface. No known structural material can survive conditions like that unprotected. So thermal protection isn’t just about keeping a vehicle from overheating, it’s a design problem that touches everything from the vehicle’s shape and structure, the choice of materials, the cooling scheme, guidance and control, even the onboard electronics. And all of that has to happen without piling on weight or bulk the vehicle can’t afford.
Mid-20th-century engineers tested thermal-protection concepts mostly by trial. They would build the vehicle, or a model of it, put it in a wind tunnel, and see how the structure holds up. But ground facilities have real limits. Only a handful in the world can even reach hypersonic conditions, and those run in short, pulsed bursts lasting mere seconds. No facility can match a vehicle’s full-scale geometry, its speed, and its thermal environment all at once.
That’s why physical testing is increasingly being supplemented, and in places replaced, by modeling. Computational fluid dynamics, paired with heat-transfer, structural, and materials calculations, lets engineers run through iteration after iteration on a computer, long before a single physical prototype exists.
In this blog, we’ll start with a quick tour of hypersonic vehicles, then dig into the physics of hypersonic heating, the materials and multilayer structures used for thermal protection, and the modern engineering approaches used to design for these extreme conditions.
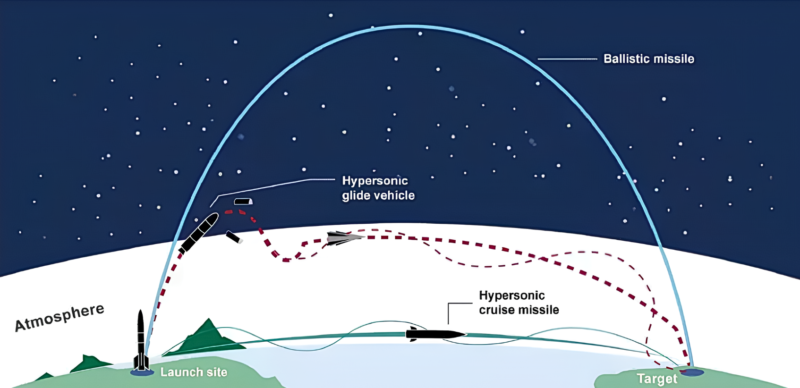
Fig. 1. Flight trajectories of different types of hypersonic vehicles [10].
Three Types of Hypersonic Propulsion Systems
Any vehicle flying at Mach 5+ experiences both mechanical and thermal loads from the surrounding air. Based on how they sustain their flight path, hypersonic vehicles fall into three broad categories: ballistic and quasi-ballistic missiles, and glide vehicles, each coming with their own unique trajectories (Figure 1). Not only do they follow unique flight paths, but they also have distinctly different physical configurations and propulsion systems.
Ballistic and quasi-ballistic vehicles (Fig. 2a, b) use liquid- or solid-propellant rocket engines, while glide vehicles (Fig. 3b) use a hypersonic ramjet that draws its oxidizer from the atmosphere.
These different propulsion systems also influence where the vehicle experiences its highest thermal loads during flight. For a hypersonic cruise missile, the highest loads occur at the nose, jet vanes, and stabilizers, particularly in thin-walled components where the flow is decelerated. For a glide vehicle, the highest loads occur at the nose and throughout the engine flow path, from inlet to nozzle.
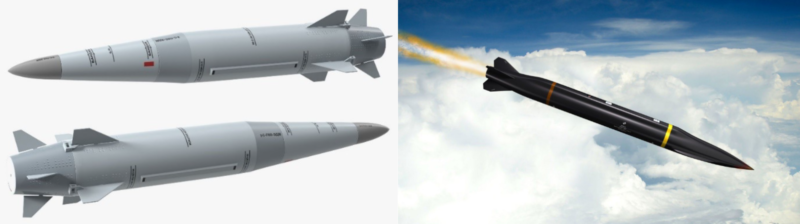
Fig. 2a, b. Kh-47M2 Kinzhal / carrier aircraft — MiG-31K(I) (a) Multi-role hypersonic missile Mako / carrier aircraft — F-35 Lightning II fighter (b).
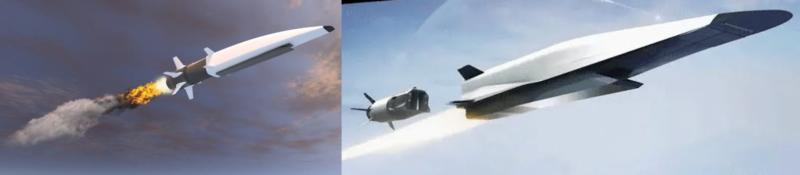
Fig. 3a, b. A hypersonic glide vehicle with its solid-fuel booster still firing (a), and after booster separation, once the scramjet has taken over (b).
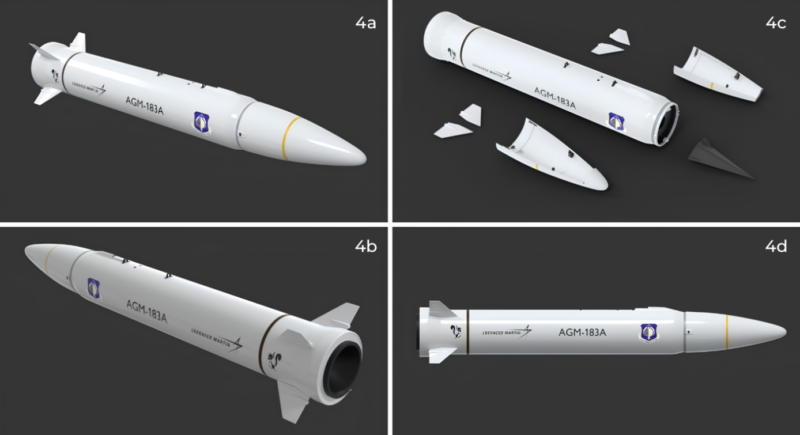
Fig. 4a-d. The AGM-183 ARRW system — an air-launched hypersonic missile used to carry a glide vehicle (such as Operational Fires). Carrier aircraft: B-52H bomber.
Figure 4c shows the glide vehicle separating from the nose of its booster. The booster lofts the glider into the stratosphere; from there it flies autonomously, either coasting at the speed the booster gave it or accelerating further with its scramjet.
Visually, a glide vehicle differs from a ballistic missile, most notably in its distinctive flat underside, which helps it generate lift and maintain its trajectory as it descends into the denser lower stratosphere.
A glide vehicle is typically powered by a hypersonic ramjet, but it can, in principle, fly without an engine at all. Without propulsion, however, its maneuverability, range, and flight time are reduced. For a glider traveling at Mach 5+, the atmosphere may be extremely thin, but it still provides enough aerodynamic force for the vehicle to generate lift and maneuver.
Why Thermal Protection Is Hard: The Physics of Hypersonic Heating
At the speeds hypersonic propulsion systems reach, an intense bow shock forms ahead of the vehicle, for missiles and gliders, converting much of the flow’s kinetic energy into internal energy. As a result, the stagnation temperature (the temperature air would reach if fully decelerated at the vehicle’s surface) climbs with altitude, from 1,300–2,500 K at Mach 5–7 to 4,000 K above Mach 10 (Fig. 5a, red line). At these temperatures air stops behaving like an ideal gas as its molecules begin to dissociate and ionization sets in at above roughly 5,000 K.
Dissociation and ionization actively convert the air molecules’ kinetic energy, noticeably lowering the real stagnation temperature behind the shock front while noticeably raising the stagnation density (Fig. 5b) — the dashed black line ignores dissociation/ionization, the solid red line accounts for it.
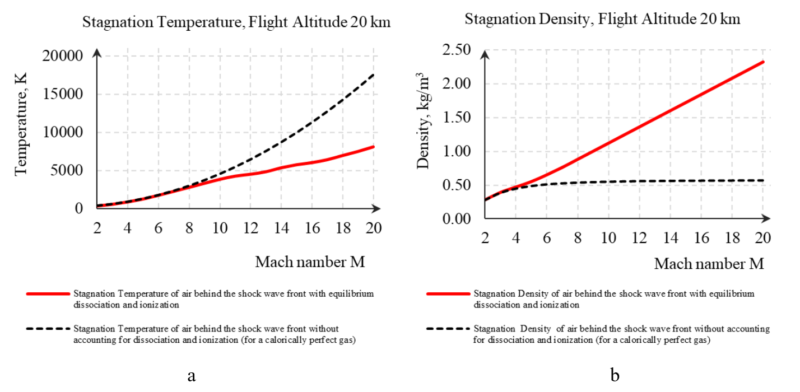
Fig. 5a, b. Stagnation temperature (a) and stagnation density (b) vs. Mach number for standard atmospheric conditions at a flight altitude of 20 km.
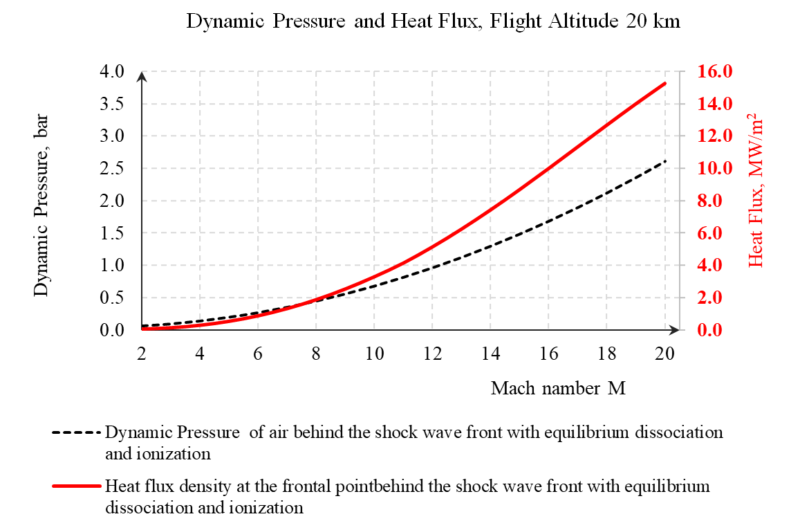
Fig. 5c. Dynamic pressure (black dashed line) and heat-flux density (solid red line) at the vehicle’s stagnation point vs. Mach number, for standard atmospheric conditions at a flight altitude of 20 km.
At a Mach number of 10 and an altitude of 20 km—where the atmosphere is cold and rarefied—the stagnation parameters of the flow may not appear particularly alarming. The heat flux in the stagnation region, however, is truly colossal (Fig. 5c). This is because the heat flux increases approximately with the cube of velocity, whereas dynamic pressure increases only with the square of velocity.
Protecting the vehicle’s internal components from this extreme heat flux is therefore a fundamental design challenge—one that ultimately influences the vehicle’s shape, structural configuration, material selection, aerodynamic design, and even its navigation and control systems. Moreover, the plasma sheath that forms around a hypersonic vehicle can interfere with conventional radio communications, further complicating navigation and control.
Modeling Challenges at a Glance for Hypersonic Propulsion Systems
Table 1 lays out the main challenges involved in modeling thermal protection. Note that it doesn’t claim to be an exhaustive survey, just what’s most visible on the surface of the problem.
Table 1 — Challenges in Modeling Hypersonic Flight
| No. | What needs to be modeled | Why it matters |
|---|---|---|
| 1 |
|
|
| 2 |
|
|
| 3 |
|
|
| 4 |
|
|
| 5 |
|
|
| 6 |
|
|
| 7 |
|
|
Figures 6–8 below show examples of nonuniform, porous insulation structures that, if used on a vehicle, need to be modeled.
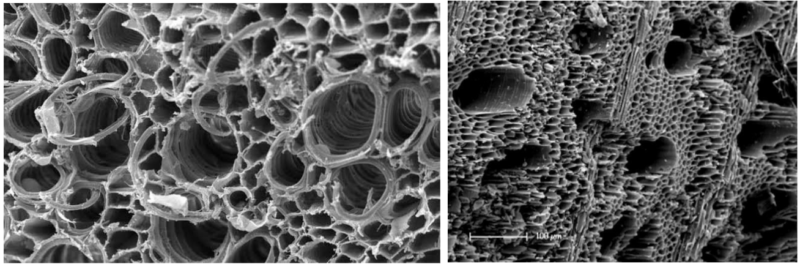
Fig. 6a, b. Porous thermal-insulation structures, magnified [3, 4]
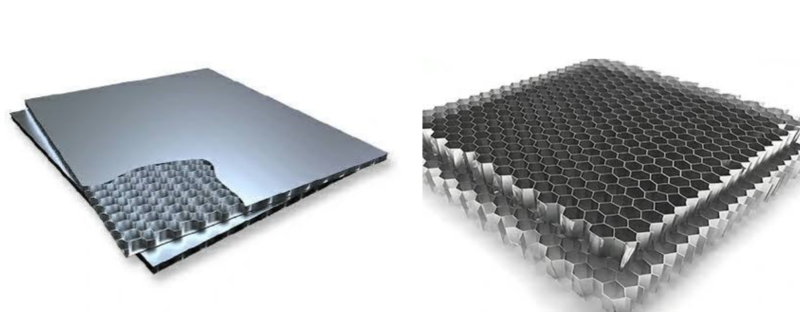
Fig. 7a, b. Honeycomb sandwich panels: core alone (b) and core with two face sheets (a) [5, 6]
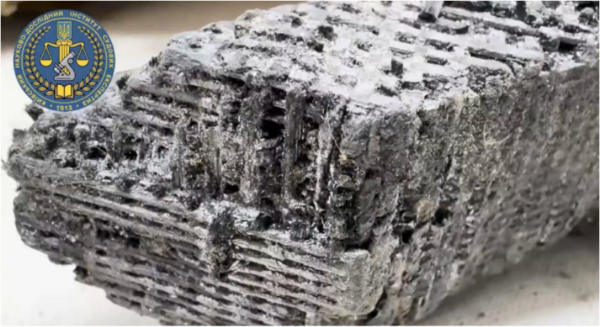
Fig. 8. A fragment of thermal insulation found at the impact site of a Russian 3M22 Zircon missile in Kyiv, February 2024. [7]
Multilayer Thermal-Protection Systems
At the temperatures reached on a hypersonic vehicle’s leading edges, today’s structural materials cannot retain their mechanical strength indefinitely. Managing this limitation is one of the central challenges in hypersonic vehicle design. Engineers work around that limit in several ways, the most universal being multilayer thermal protection.
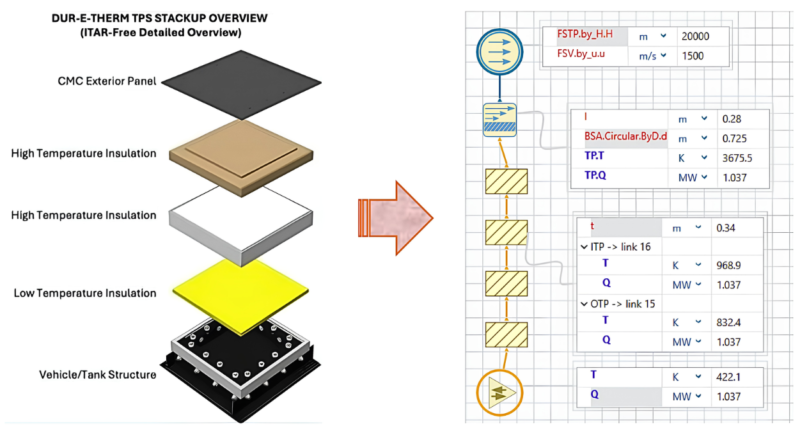
Fig. 9. DUR-E-THERM TPS stackup modeled in AxSTREAM
Figure 9 shows a multilayer thermal-protection stack (a) and its modeling in AxSTREAM (b). The outer layer is typically ablative. Beneath it, two layers form a high-temperature thermal barrier: one provides high thermal resistance, while the other provides mechanical strength and vibration resistance. A low-temperature insulation layer provides an additional thermal barrier, followed by the vehicle’s underlying structural surface.
Table 2 — Structure of a Multilayer Thermal-Protection System for Hypersonic Propulsion Systems
| No. | Layer name | Function | Material(s) |
|---|---|---|---|
| 1 | Outer ablative layer | Absorbs the primary heat flux; shields the underlying layers from extreme temperature; sheds heat through pyrolysis, evaporation, sublimation, and mass loss; forms a protective gas layer at the surface; partly reduces heat flux via endothermic reactions | Phenolic ablators; carbon-phenolic composites; silicone ablators; PICA and other porous ablative materials |
| 2 | High-temperature thermal-barrier layer | Withstands the high temperature that gets through the ablative layer; reduces heat transfer deeper into the structure; retains its thermal and mechanical properties at high temperature | Ceramics; carbon-carbon composites; ceramic matrix composites (CMCs); high-temperature insulating materials |
| 3 | High-temperature structural transition layer | Carries mechanical and thermal loads; maintains the thermal-protection system’s structural integrity; further limits heat transfer; provides a transition between materials with different thermal and mechanical properties; reduces thermal stress from mismatched expansion coefficients | Carbon-carbon composites; superalloys; titanium alloys; high-temperature composites; ceramic matrix composites |
| 4 | Low-temperature insulation layer | Cuts the heat flux reaching the vehicle’s structure; carries most of the temperature drop between the hot outer layers and the airframe; keeps the structure’s temperature within allowable limits; adds insulation at relatively low weight | Silica fibers; aluminosilicate fibers; ceramic fibers; aerogels; high-temperature porous insulating materials |
| 5 | Load-bearing structure / vehicle surface | Carries the primary structural loads; maintains the vehicle’s geometric and mechanical integrity; is shielded from excessive heating by the preceding layers; must operate within an allowable temperature range | Aluminum alloys; titanium alloys; steels; nickel superalloys; carbon-fiber composites and other structural composites |
The Classic Approach to Assessing Heat Conduction
A natural starting point for understanding how a structure responds to this heat flux is the classic problem of unsteady heat conduction in a solid. Here, a section of the vehicle structure can be represented as a finite, uniform cylinder with its outer surface exposed to a hot, streamwise airflow at Mach 10 and an altitude of 20 km.
The resulting one-dimensional, unsteady heat-conduction equation can be solved analytically using separation of variables. The radial dependence is expressed as a series of Bessel functions, which naturally describe heat conduction in cylindrical geometry, while the time dependence is represented by a Fourier series based on the corresponding eigenvalues.
Figures 10a and 10b show the resulting temperature field: Figure 10a plots temperature over time on the axis, at half the radius, and at the surface (r/R = 0, 0.5, 1) over several minutes of flight; while Figure 10b shows the radial temperature profile at successive moments in time.
Both plots confirm the classic picture, that the surface heats up almost instantly, while the core lags behind and only gradually catches up in temperature.
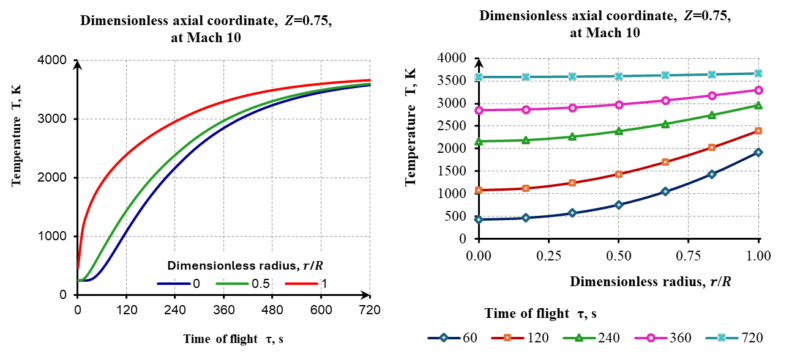
Fig. 10a, b. Heating of a finite cylinder over time (a), and radial temperature profiles at different points in time (b).
This classic solution is a useful first approximation, but it rests on three simplifications that a real hypersonic vehicle doesn’t satisfy. First, its structure isn’t a uniform cylinder but a multilayer stack of materials with very different properties; second, the medium delivering heat to the vehicle isn’t ordinary air with known tabulated properties, but a dissociated gas; and third, it leaves out convective heat transfer.
From CFD to Digital Twins: Modern Hypersonic Propulsion System Modeling
Modern modeling closes those three gaps by pairing computational fluid dynamics (CFD) with conjugate heat transfer (CHT) analysis. Together they predict both the aerodynamic heating and the temperature distribution across the whole structure, without requiring a physical test of every candidate shape.
Today’s turbulence models for compressible flow, including compressibility-corrected RANS, hybrid RANS-LES schemes, capture the two-way coupling between the flow and the heated wall, which noticeably improves the prediction of laminar-to-turbulent transition in the boundary layer.
Table 3 shows the mass composition of dissociated, partially ionized air at 20 km altitude (p ≈ 0.055 bar) — from cold, undissociated air (216.65 K, U.S. Standard Atmosphere, 1976 [23]) through 3000–6000 K. Figures 11a–c then show AxSTREAM’s Fluid Calculator computing the key thermophysical properties of both the cold ambient air and the hot, stagnated, dissociated/ionized air, for two flight speeds: Mach 8.4 (T⁰ = 3000 K) and Mach 15.9 (T⁰ = 6000 K). It’s ultimately the freestream velocity, together with these thermophysical properties and transport coefficients, that determines the resulting convective heat-transfer coefficient at the vehicle’s surface.
Table 3 — Composition of Dissociated Air at 20 km Altitude at Different Mach Numbers
| Component | 216.65 K (cold air) |
M=8.4, T⁰=3000 K, p⁰=0.5 bar* |
M=10.5, T⁰=4000 K, p⁰=0.8 bar |
M=13.1, T⁰=5000 K, p⁰=1.2 bar |
M=15.9, T⁰=6000 K, p⁰=1.7 bar |
How it changes |
|---|---|---|---|---|---|---|
| Molecular nitrogen, N₂ | 75.58% | 73.9% | 74.5% | 68.7% | 37.0% | Dominant species throughout; stable until ~4000 K, then falls sharply as N₂ splits into atomic nitrogen. |
| Molecular oxygen, O₂ | 23.16% | 11.6% | 0.31% | 0.014% | 0.013% | Collapses almost completely by 4000 K — its bond is weaker than N₂’s, so it breaks apart first. |
| Atomic oxygen, O | 0% | 9.7% | 22.1% | 22.9% | 23.0% | Rises steadily as O₂ dissociates, then levels off around 5000 K. |
| Atomic nitrogen, N | 0% | ~0% | 0.36% | 6.6% | 38.5% | Negligible at first, then surges — the main product of N₂ breaking apart at 5000–6000 K. |
| Nitric oxide, NO | 0% | 3.6% | 1.5% | 0.51% | 0.17% | A transient product of N + O that steadily declines as it too breaks down and ionizes. |
| Nitrosyl ion, NO⁺ | 0% | ~0% | 0.0011% | 0.013% | 0.056% | Grows steadily — NO has the lowest ionization energy of any species here, so it ionizes first. |
| Nitrogen ion, N⁺ | 0% | ~0% | ~0% | ~0% | 0.0043% | Appears last — atomic nitrogen has the highest ionization energy of the group. |
| Oxygen ion, O⁺ | 0% | ~0% | ~0% | ~0% | 0.0030% | Forms a bit more readily than N⁺, but stays well below NO⁺. |
| Free electrons, e⁻ | 0% | ~0% | ~0% | ~0% | ~0% | Negligible by mass, but their numbers climb by orders of magnitude — the real gauge of ionization. |
| Argon, Ar (inert) | 1.28% | 1.28% | 1.28% | 1.28% | 1.28% | Chemically inert — its mass share barely moves. |
* Flight Mach number, and stagnation temperature and pressure, are given for each hot column.

Fig. 11a–c. AxSTREAM’s Fluid Calculator: thermophysical properties of cold ambient air at 20 km (a), and of hot, stagnated, dissociated/ionized air at Mach 8.4 (b) and Mach 15.9 (c).
Table 4 — Thermodynamic and Transport Properties of Dissociated Air at 20 km Altitude at Different Mach Numbers, Computed in AxSTREAM
| Parameter | 216.65 K (cold air) |
3000 K | 4000 K | 5000 K | 6000 K |
|---|---|---|---|---|---|
| Bulk gas properties | |||||
| Density, ρ (kg/m³) | 0.0880 | 0.0058 | 0.0040 | 0.0030 | 0.0020 |
| Stagnation density, ρ⁰ (kg/m³) | 0.088 | 0.053 | 0.054 | 0.066 | 0.064 |
| Mean molar mass, M (g/mol) | 28.96 | 26.64 | 25.51 | 22.78 | 18.74 |
| Specific heat — frozen composition | |||||
| Isobaric, cp,frozen (kJ/(kg·K)) | 1.00 | 1.30 | 1.32 | 1.37 | 1.58 |
| Isochoric, cv,frozen (kJ/(kg·K)) | 0.712 | 0.989 | 1.00 | 1.01 | 1.14 |
| Ratio γ = cp/cv, frozen | 1.403 | 1.316 | 1.327 | 1.364 | 1.390 |
| Specific heat — chemical equilibrium (reactive)** | |||||
| Isobaric, cp,eq (kJ/(kg·K)) | ≈ cp,frozen * | 5.16 | 2.04 | 6.63 | 17.21 |
| Isochoric, cv,eq (kJ/(kg·K)) | ≈ cv,frozen * | 4.38 | 1.62 | 5.69 | 14.01 |
| Ratio γ = cp/cv, equilibrium | ≈ 1.403 * | 1.18 | 1.26 | 1.17 | 1.23 |
| Transport properties (frozen mixture) | |||||
| Dynamic viscosity, μ (μPa·s) | 14.22 | 81.62 | 97.20 | 103.90 | 102.94 |
| Kinematic viscosity, ν (cm²/s) | 1.62 | 140.7 | 243.0 | 346.3 | 514.7 |
| Thermal conductivity, λ (mW/(m·K)) | 20.25 | 150.4 | 183.0 | 204.1 | 237.8 |
Figure 12a shows CFD results using a DES/RANS-LES approach [8], depicting the structure of the flow behind the bow shock as isotherms, for airflow over a poorly streamlined model body at Mach 16.
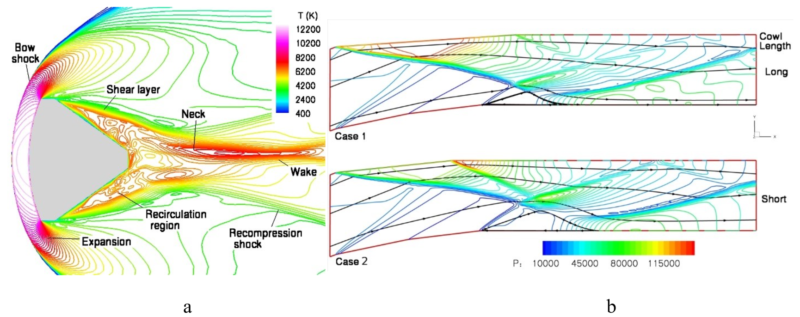
Fig. 12a, b. CFD results computed using an in-house DES/RANS-LES solver developed by the paper’s authors [8, 9].
The bow shock is clearly visible, with a stagnation temperature behind it reaching 12,200 K. The isotherms clearly mark out the characteristic flow zones, compression and expansion regions. But comparing this with the plot in Figure 10a immediately shows that the incoming-flow model here uses a non-dissociated, non-ionized ideal gas, which lines up with the dashed black curve at Mach 16.
If dissociation and ionization were accounted for, the temperature would be around 6,000 K — half as much. That’s an argument for why a crude, back-of-the-envelope estimate, the kind you’d do in a spreadsheet, in a mid-20th-century spirit, is still useful at the very start of any calculation.
Properly accounting for dissociation, ionization, catalytic surface reactions, and radiative heating requires heavier, high-temperature CFD solvers with multi-species chemical kinetics and thermochemical nonequilibrium. Reproducing these effects experimentally is nearly impossible because there are only a handful of working hypersonic wind tunnels in the world, they run in pulsed mode for brief intervals, and it’s impossible to simultaneously match the geometric, dynamic, and thermal similarity between a full-scale vehicle and its test model.
So hypersonic-flight analysis has no real alternative to comprehensive modeling, in which aerothermal loads from CFD are fed into finite-element (FE) models that estimate thermal stress, deformation, and fatigue life. This coupled approach makes it possible to spot critical zones, like stress concentrators, the joints between dissimilar materials, and also refine the design before the first prototype is ever built.
Once the aerodynamic, thermal, structural, and material models are finally combined on a single computational platform, multidisciplinary design optimization (MDO) becomes possible: automatically sweeping through hundreds of geometry and cooling-scheme variants to find the best balance of weight, thermal protection, and aerodynamics — again, without machining a single part.
Taking this idea further gives you a digital twin, a numerical model of the vehicle that keeps updating from telemetry gathered during a handful of flight tests, narrowing the prediction’s uncertainty and making each successive design iteration more accurate than the last.
Verification, Validation, and Uncertainty
Modern hypersonic propulsion system development typically follows a building-block approach to verification and validation (V&V). Rather than testing a complete vehicle under every possible flight condition, engineers first use a limited number of carefully planned experiments in shock tunnels and impulse facilities to validate numerical models against simpler, well-understood flow cases. Once the models have been validated, they can be applied to the full-scale vehicle and across its flight trajectory.
This approach does not eliminate experiments; physical testing remains the final authority. Instead, it reduces the need for expensive full-scale testing of every design variant by establishing confidence in the models step by step.
That leaves one last, uncomfortable question: how much can you actually trust these computational models?
Turbulence, high-temperature material properties, boundary conditions are all known only within some margin of error. Uncertainty-quantification (UQ) methods let engineers assess safety margins statistically rather than by eye, which reduces reliance on over-engineered design margins and, just as importantly, cuts down on the extra tests needed solely to confirm those margins.
Conclusions
Thermal protection for a hypersonic vehicle at Mach 5+ is a coupled multidisciplinary problem involving aerodynamic heating, steep temperature gradients, material behavior, and structural response. Physical testing alone cannot efficiently address it: ground facilities have limitations, scaled models may not preserve the relevant physics, and flight tests are expensive and risky. Modern development therefore relies on multidisciplinary modeling, including CFD, conjugate heat transfer, thermochemical nonequilibrium, finite-element analysis, MDO, and UQ, validated through carefully planned building-block experiments.
The practical takeaway is that coupled thermomechanical analysis must begin early, not be added after the vehicle geometry is frozen. Material selection, thermal protection, cooling, and propulsion are interconnected design decisions that need to be considered together. [11–19]
References
- Plain, C. “Radian Aerospace Reveals Next-Generation Spacecraft Material “Dur-E-Therm” Designed to Withstand Single-Stage-to-Orbit Flight”, March 24, 2025.
- Aquatool. “Activated Carbon in Water Treatment”, July 31, 2023.
- https://www.researchgate.net/figure/Biochar-under-a-microscope-Brownsort-UK-Biochar-Research-Centre-From_fig1_317185366
- https://encrypted-tbn0.gstatic.com/images?q=tbn:ANd9GcTn-C82bb3zU7igNU1MjMkSLlNQB9Uxh4toLgjs9gv0MxmRadGSjK0l2L4&s=10
- https://encrypted-tbn0.gstatic.com/images?q=tbn:ANd9GcTSVUHyw5CnGdytfND8ZQzm8p7EITaCId3zqn46dd0hoQ&s=10
- Hypersonic weapons, https://deepstateua.com/hypersonic_missiles/
- Sinha, K., Candle, Graham V., “Grid Sensitivity of Detached eddy simulation of a Mach 16 Re-entry Configuration“. 45th AIAA Aerospace Sciences Meeting and Exhibit, Nevada, Reno, 2007.
- N. Rane, V. Pawar and K. Sinha, “Effect of geometric variations on three-dimensional flow separation in a practical scramjet inlet”, 12th Annual AeSI CFD Symposium 2010, Indian Institute of Science, Bangalore, India, 2010.
- https://www.aerotime.aero/articles/what-are-hypersonic-weapons
- Anderson J. D. Hypersonic and High-Temperature Gas Dynamics. 2nd ed. Reston, VA: AIAA, 2006.
- Sutton G. P., Biblarz O. Rocket Propulsion Elements. 9th ed. Hoboken, NJ: John Wiley & Sons, 2017.
- Hill P., Peterson C. Mechanics and Thermodynamics of Propulsion. 2nd ed. Upper Saddle River, NJ: Pearson Education, 1992.
- Bruno C. Airbreathing Hypersonic Propulsion: An Introduction. 2nd ed. Singapore: Springer, 2026.
- NASA. Hypersonics. Available at: https://www.nasa.gov/hypersonics (accessed July 27, 2026).
- NASA Langley Research Center. VULCAN-CFD Related Publications. Collection of publications on numerical simulation of hypersonic flows and aerothermodynamics.
- American Institute of Aeronautics and Astronautics (AIAA). Hypersonic Propulsion Concepts: Design, Control, Operation, and Testing. AIAA educational course on the design, operation, control, and testing of hypersonic propulsion systems.
- American Institute of Aeronautics and Astronautics (AIAA). Scramjet Propulsion: The Systems and Technologies to Enable Hypersonic Flight. Reference materials on supersonic combustion ramjet (scramjet) propulsion systems and enabling technologies for hypersonic flight.
- European Space Agency (ESA). Thermal Protection Systems and High-Temperature Materials. ESA technical resources on spacecraft thermal protection systems and high-temperature materials.
- NASA CEA (Chemical Equilibrium with Applications) — reference thermochemical equilibrium code. Available at: https://www1.grc.nasa.gov/research-and-engineering/ceaweb/
- Park C. Nonequilibrium Hypersonic Aerothermodynamics. Wiley, 1990.
- Zel’dovich Y. B., Raizer Y. P. Physics of Shock Waves and High-Temperature Hydrodynamic Phenomena. Academic Press, 1966/2002.
- U.S. Standard Atmosphere, 1976. Used here for the pressure–altitude relationship (p(20 km) ≈ 5,475 Pa).
"*" indicates required fields